How to Use a Friction Coefficient Tester Effectively?
Using a Friction Coefficient Tester effectively is crucial for various industries. This device measures the friction between surfaces, providing essential data for both product development and quality control. Understanding the nuances of its operation can dramatically impact results.
A Friction Coefficient Tester can be tricky. For beginners, it may seem straightforward, but misunderstandings often arise. Therefore, it's important to approach it with care. Calibration is one aspect that often gets overlooked. If not done right, the results may be misleading. Environmental factors, like temperature, play a significant role.
Proper technique is vital when using a Friction Coefficient Tester. Ensure that surfaces are clean and dry before testing. Data interpretation requires critical thinking. What do the numbers really mean? Sometimes, results are not as clear as they seem. Reflecting on these results helps improve future tests. Ultimately, mastering this tester takes time and practice. The learning process is valuable, enhancing both skills and knowledge in this field.

Understanding Friction Coefficients and Their Importance in Testing
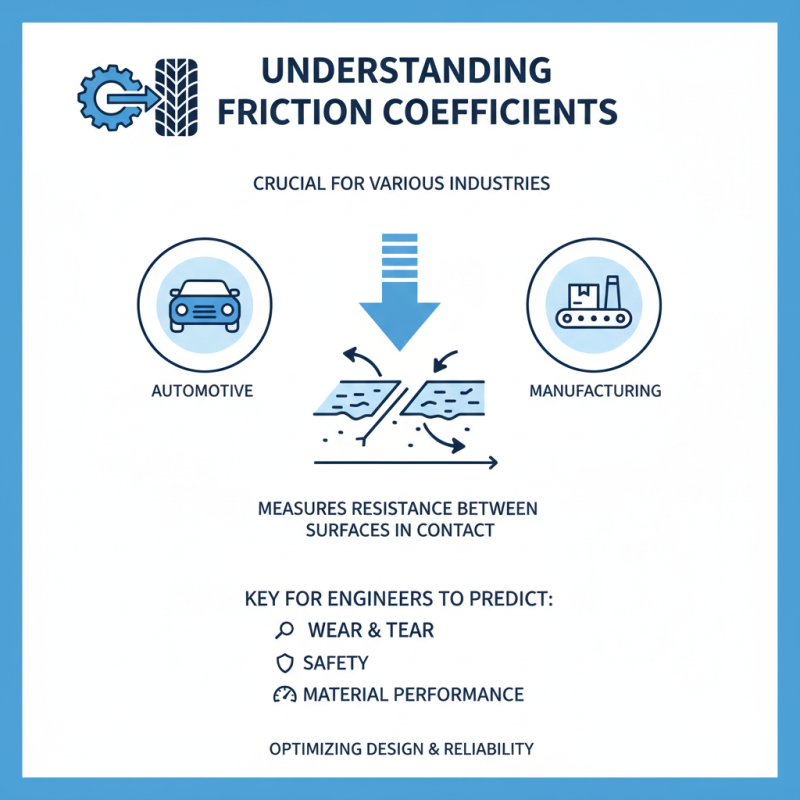
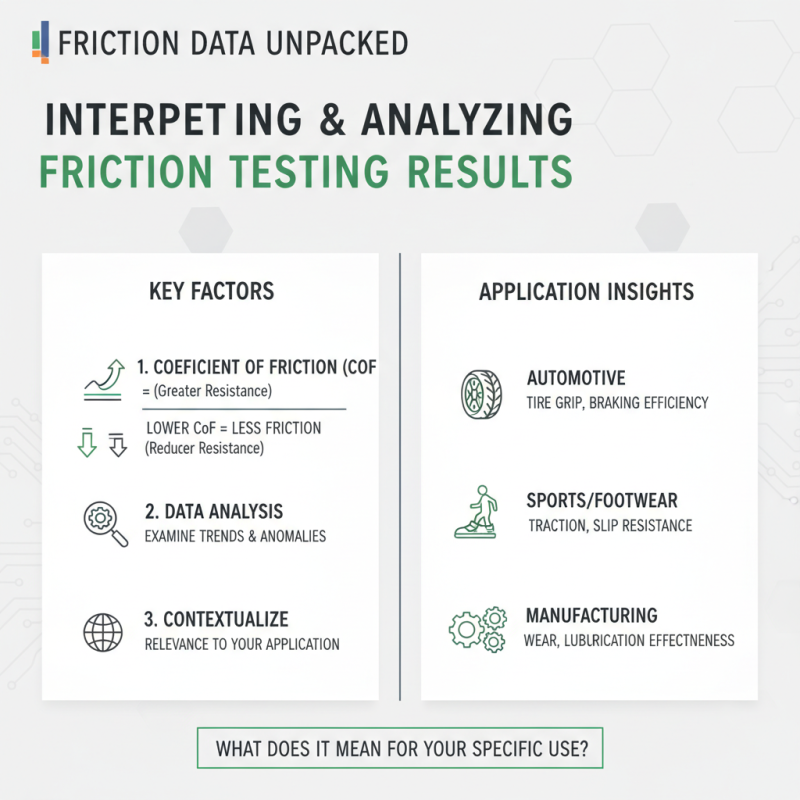
Friction coefficients are crucial for various industries, including automotive and manufacturing. They measure the resistance between two surfaces in contact. Understanding these values helps engineers predict wear and tear, safety, and overall performance of materials.
According to a 2020 industry report, optimal friction coefficients for rubber on asphalt range from 0.6 to 0.8. However, many tests reveal results that fall outside this range. These inconsistencies can occur due to surface contamination or material degradation. Such factors require careful consideration during testing.
Testing methods such as the ASTM D1894 provide insights but may not always be comprehensive. Some researchers suggest the need for more rigorous standards. Variability in environmental conditions during tests can lead to skewed data. Thus, achieving accurate friction coefficient readings is a challenge worth addressing.
Choosing the Right Friction Coefficient Tester for Your Needs
Choosing the right friction coefficient tester is crucial for accurate measurements. Different materials can drastically change friction results. For instance, rubber against concrete shows a static friction coefficient of around 1.0, while metal on metal may drop to 0.1. Understanding these variations helps in selecting the right tester for your specific application.
Different testers come with various features, such as digital displays and adjustable load settings. A tester with a load of 5 kg may offer a different reading than one at 10 kg. This can affect data accuracy. Additionally, some testers may not perform well in all environmental conditions. For example, high humidity can impact results. Reflection on selecting a tester that can adapt to your working conditions is essential.
Data from industry reports indicates that nearly 30% of testers fail to meet the required standards. This highlights the importance of thorough evaluations before purchasing. Engaging in careful consideration of available options can lead to better choices. Testers should match your specific materials and conditions to achieve reliable measurements.
How to Use a Friction Coefficient Tester Effectively?
| Tester Type |
Measurement Range |
Accuracy |
Features |
Price Range |
| Digital Friction Tester |
0.01 - 1.00 |
±0.01 |
Digital display, Data storage |
$200 - $500 |
| Mechanical Friction Tester |
0.05 - 0.80 |
±0.02 |
Simple operation, Robust design |
$100 - $300 |
| Portable Friction Tester |
0.01 - 0.90 |
±0.03 |
Lightweight, Battery operated |
$150 - $400 |
| Computerized Friction Tester |
0.001 - 1.00 |
±0.005 |
Advanced analysis, Software included |
$500 - $1000 |
Preparing the Surface and Sample for Accurate Testing
Preparing the surface and sample is crucial for accurate testing with a friction coefficient tester. A clean surface can significantly influence results. Researchers show that contaminants like dust and oil can alter the friction coefficient by as much as 30%. This means meticulous cleaning is necessary.
Start by choosing the right cleaning method. Use solvents that evaporate completely, leaving no residue. After cleaning, let surfaces dry to ensure no moisture impacts the test. According to a recent study, surfaces that are properly dried exhibit a friction coefficient variability of merely 5%. An effective visual inspection can help spot any remaining impurities.
Sample preparation should also consider the material properties. For instance, rough or uneven surfaces lead to unpredictable results. Surface roughness can introduce errors exceeding 15% in friction readings. Regularly checking sample dimensions is essential. Inconsistencies can skew results, reinforcing the need for precision. Use measuring tools to confirm that samples meet the required specifications. This attention to detail can elevate testing accuracy considerably.
Friction Coefficient Testing Results
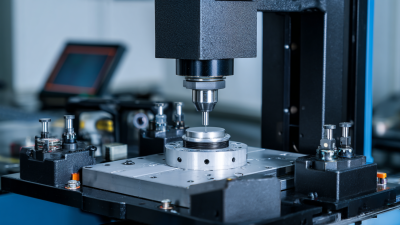
Step-by-Step Guide to Conducting the Friction Coefficient Test
When conducting a friction coefficient test, prepare your workspace carefully. Clean the surfaces of both the tester and the materials. Dust can alter results. Ensure your testing surfaces are flat and stable. Any imbalance may lead to inaccurate measurements.
Select the material samples wisely. Different materials will exhibit varying friction coefficients. You might find that certain combinations yield unexpected results. Experiment with diverse materials to gain a comprehensive understanding. Take detailed notes on each test.
Tips: Always conduct multiple trials. This helps in obtaining reliable data. Be aware of temperature and humidity. These factors can affect friction readings. If results seem inconsistent, double-check your setup. Reflection on your procedure can lead to improved accuracy.


 Home
Home